 Folio Writer
Figures that regenerate themselves:
dynamic plotting with Quarto, Python & R
The most dangerous figure in a manuscript is the one made by hand three revisions ago. When the analysis changes and the PNG doesn't, the paper quietly lies. The fix: put the code in the manuscript and let every compile regenerate the plot from the data — Quarto executes it, Folio Writer orchestrates it.
The idea in one block
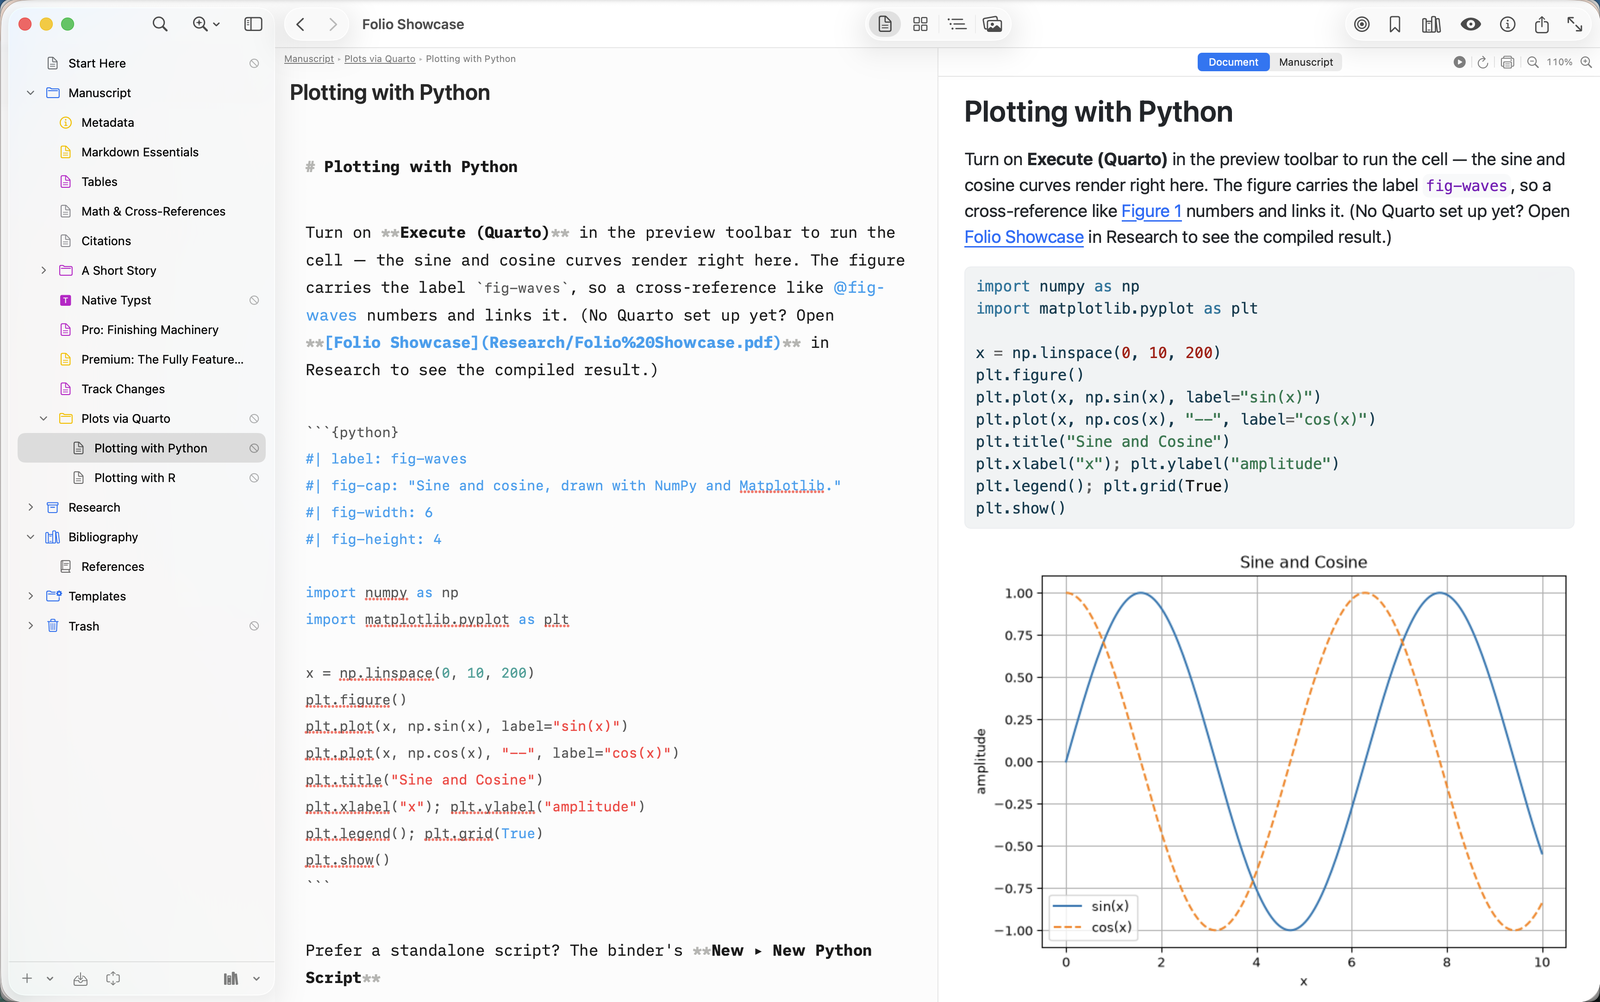
Anywhere in a Folio document, write an executable cell instead of pasting an image:
```{python}
#| label: fig-eos
#| fig-cap: "Third-order Birch–Murnaghan fit to the P–V data."
import pandas as pd, matplotlib.pyplot as plt
d = pd.read_csv("Research/pv-data.csv")
plt.plot(d.V, d.P, "o"); plt.plot(d.V, fit(d.V))
plt.xlabel("V (ų)"); plt.ylabel("P (GPa)")
```
Compile with Renderer = Quarto and the cell runs: the CSV is
read, the fit is drawn, and the finished figure lands in the PDF — or the
Word file, or the HTML — numbered, captioned, and referenced with
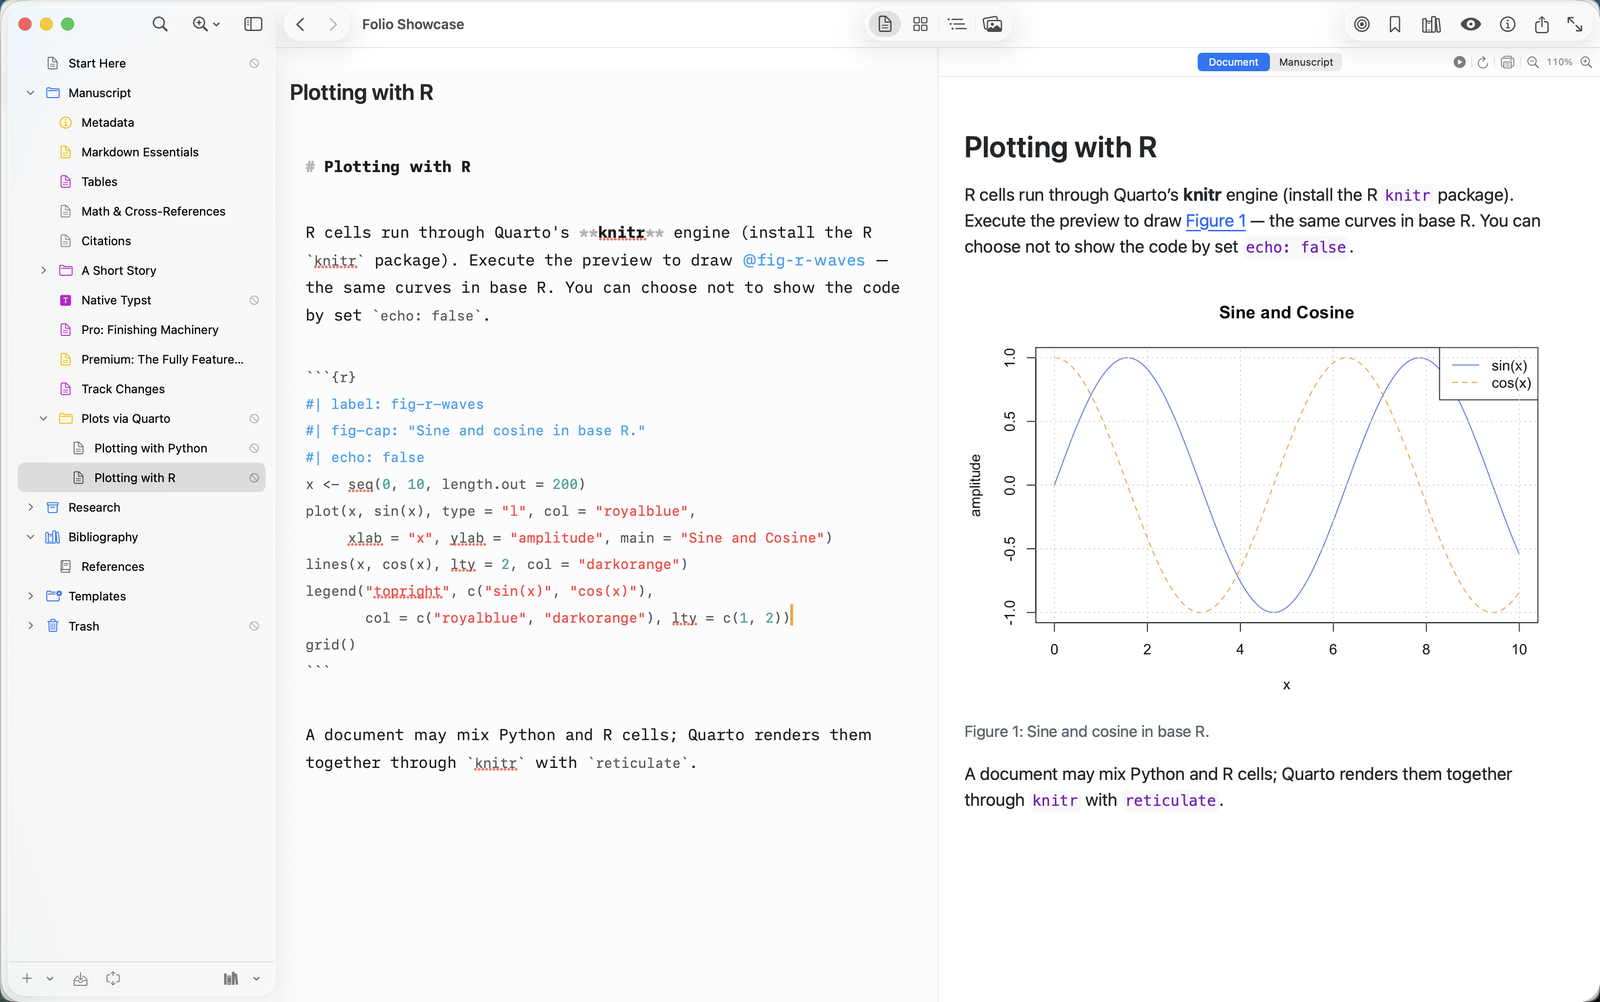
@fig-eos like any other figure. R works identically:
```{r}
#| label: fig-spectra
#| fig-cap: "Raman spectra by pressure step."
library(ggplot2)
ggplot(read.csv("Research/spectra.csv"),
       aes(shift, intensity, color = factor(P))) + geom_line()
```
Update the data file, recompile, and every figure is current. No export step, no "which script made figure 3?", no stale plots — the manuscript is the pipeline.
Setting it up
- Install Quarto (quarto.org,
or
brew install quarto) and the free Folio Helper, which lets the sandboxed App Store app run your local toolchain. - Python cells: you need a Python with Jupyter
(
pip install jupyter matplotlib pandas). Folio points Quarto at a Jupyter-capable interpreter automatically, so cells execute against a Python that can actually run them — not whateverpython3happens to be first on the PATH. - R cells: install R plus
knitrandrmarkdown— Quarto's standard R engine. - Keep data and analysis scripts in the project's Research folder, so the whole pipeline travels (and syncs) with the manuscript.
The cell options that matter for manuscripts
Quarto cell options ride along as #| comment lines. Five
cover almost every manuscript need:
```{python}
#| label: fig-eos          # cite it as @fig-eos
#| fig-cap: "Compression curve with third-order fit."
#| echo: false             # figure in the paper, code not
#| fig-width: 6.5          # inches, match the journal column
#| warning: false          # keep library chatter out of the PDF
...
```
For a whole manuscript where no code should ever print, set it once in the Metadata document instead of per cell:
execute:
  echo: false
  warning: false
#| cache: true to
an expensive cell — Quarto re-runs it only when the cell's code changes,
so recompiling after a prose edit doesn't re-fit your model.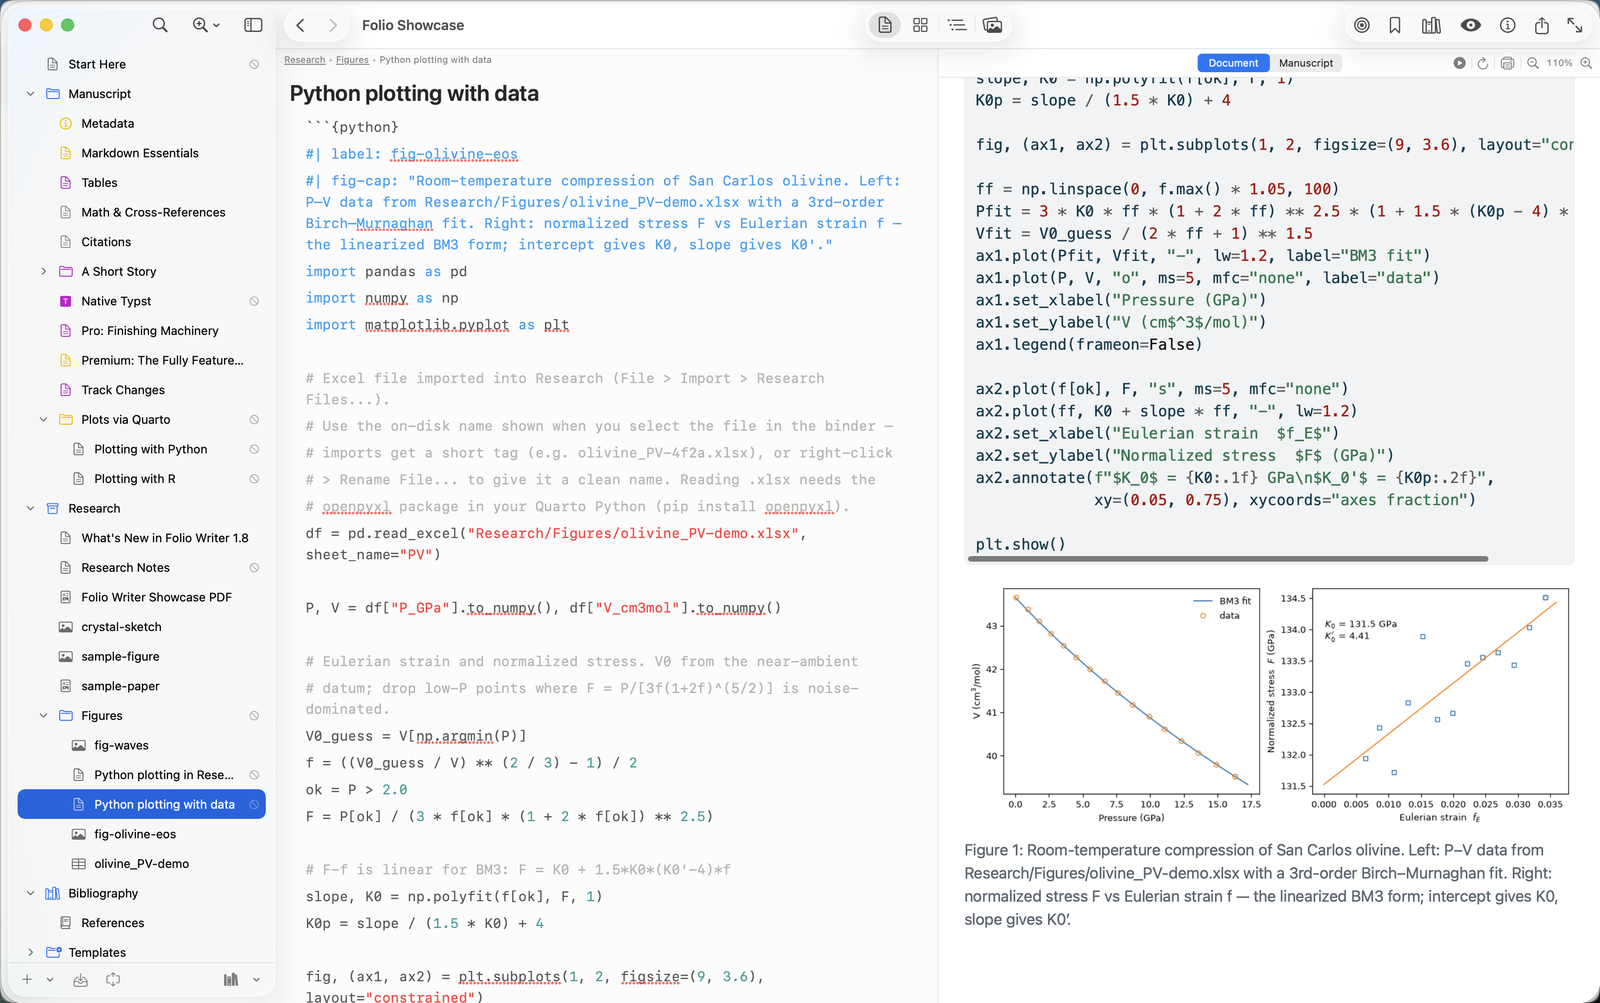
If cells don't run
Three causes cover nearly every case. Wrong renderer: code
executes only when the compile sheet's Renderer is Quarto — under
pandoc or Typst, cells pass through as literal code blocks (by design:
those pipelines never execute anything). Missing engine:
Compile ▸ Set Up External Tools… checks your toolchain; for Python
cells you need Jupyter on the interpreter (pip install
jupyter), for R you need knitr +
rmarkdown. Path assumptions: cells run with the
project as working directory, so read data as
Research/pv-data.csv, not an absolute path from your other
machine — keeping paths project-relative is also what keeps the
manuscript reproducible for co-authors.
Static when you want it, dynamic when it matters
Executable cells and ordinary figures coexist. A photograph or a hand-drawn schematic stays a normal Markdown image; the plots derived from data become cells. Folio's manuscript check even watches the static kind — flagging a figure that's older than the script that draws it — so whichever route a figure takes, it can't silently go stale.
Journal-grade output included
Because the Quarto renderer is the same one that powers
journal formats, dynamic figures work in
publisher templates too: add a journal extension (AGU, Elsevier,
Copernicus…), set quarto-to: in the metadata, and the
compiled submission carries figures generated from your live analysis —
reproducible from the plain files in the project, by anyone, with one
command.